Turning Roadshows Into Measurable Environments


Trusted by

From Footfall Counts to a Spatial Data Layer for Experiential Marketing
The Challenge: Measuring Impact Beyond Footfall
Experiential roadshows are complex campaigns. Big spend, lots of moving parts, strong visual outputs. But when it comes to proving what worked, the toolkit has historically been thin - headcount on the door, a few anecdotal quotes, maybe a survey at the exit.
Movico wanted to get past that. The questions they kept running into: which parts of the experience were actually engaging visitors and which were just pulling footfall? How did performance change by location, city and venue type? What content and installations were driving real value? And how could insight from one stop be used to improve the next?
The problem wasn’t execution. The execution was strong. It was measurement.
“We had great experiences and strong attendance, but limited visibility into what was reallyworking inside the space.”
Stefan Aspers, CEO, Movico
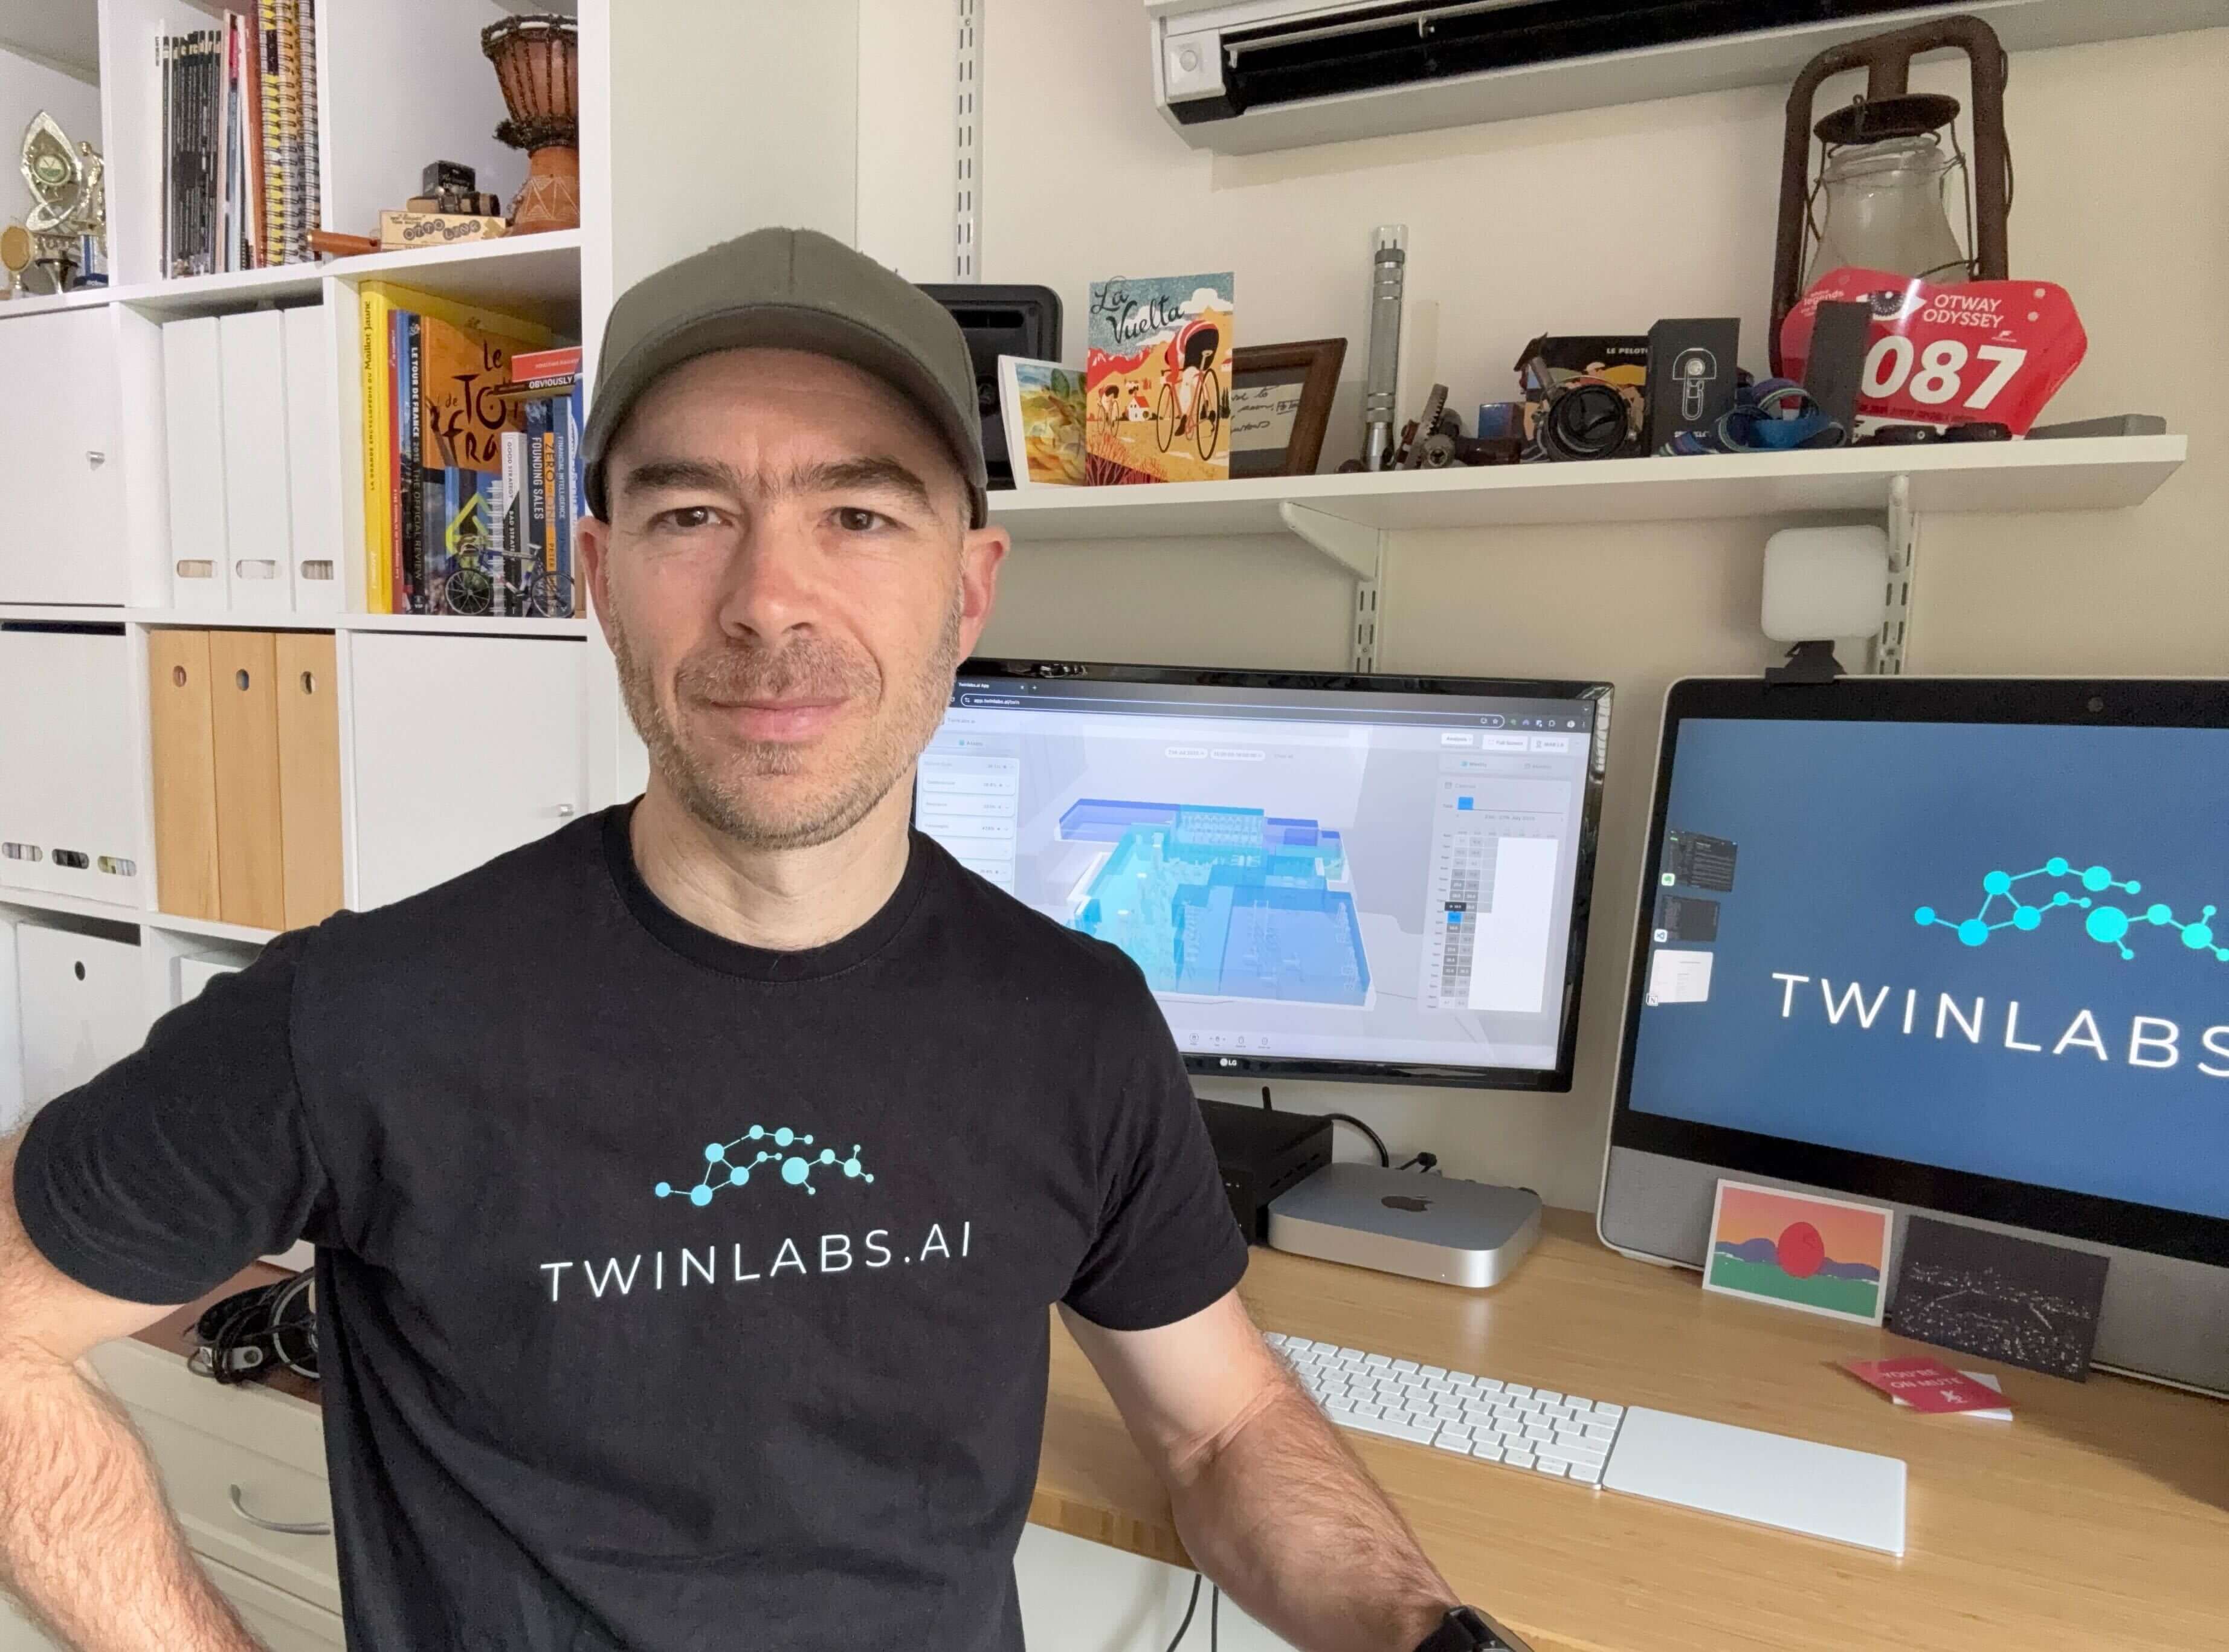
The TwinLabs Solution
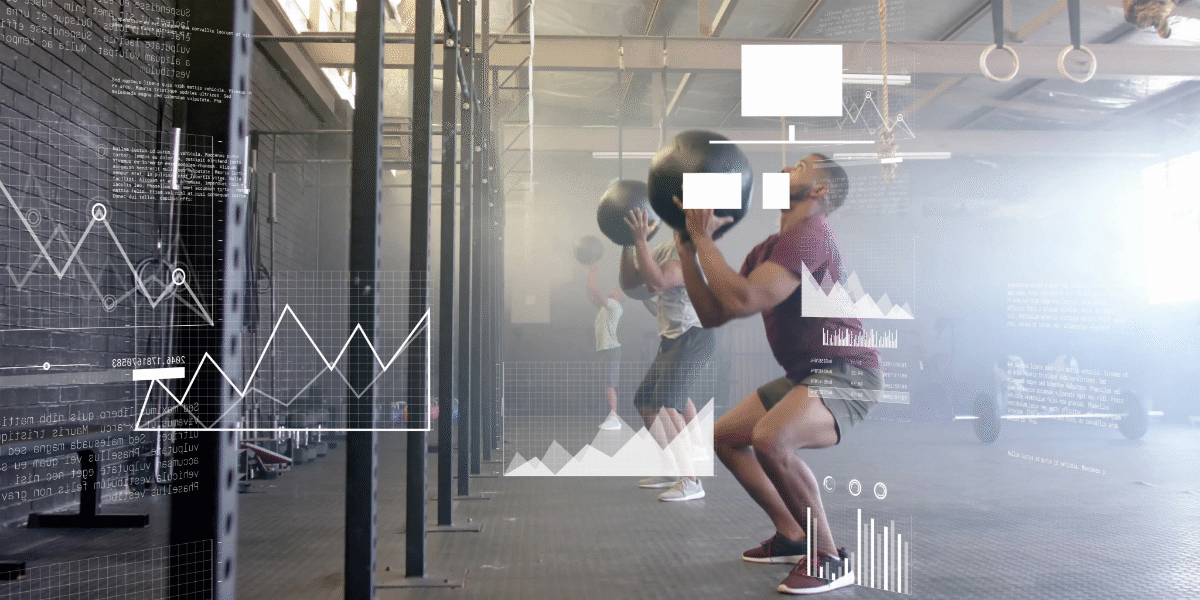
TwinLabs deployed Event Twin across one of Movico’s customer roadshows, creating a digital twin of the physical experience at each stop. That gave Movico continuous visitor flow across the space, percentage utilisation of specific zones and installations, movement patterns between zones, and like-for-like performance comparisons across locations.
Unlike traditional reporting, the platform produced a spatially accurate view of engagement rather than just counts - what was used, where, and how that lined up with the content around it. One framework, every venue, same rules.
“For the first time, we could actually see how people moved through the experience and what they engaged with.”
Stefan Aspers, CEO, Movico
What the Data Revealed
- Not all zones hold attention equally. Some installations pulled high traffic but ran at low percentage utilisation - people glanced and moved on. Others, usually the immersive or interactive ones, held much higher utilisation throughout the day. That gave Movico a way to separate attraction (footfall) from engagement (percentage utilisation), and stop treating them as the
same thing. - Location strongly influences performance. Large urban sites significantly outperformed smaller or industrial locations - in footfall, percentage utilisation and flow through the experience. A clear basis for smarter location planning and better targeting of future activations.
- Same platform, four audiences, four interpretations. The roadshow toured four fundamentally different venue types: client sites(B2B), public venues (B2C), university campuses, and the customer’s own offices. Same platform deployed at every stop. Same metrics. But the numbers meant something different every time. A busy hour at a public venue looked nothing like a busy hour at a subsidiary office. High percentage utilisation on a university stand carried a different meaning than the same number at a client site. The platform handled the measurement; Movico’s team handled the meaning.
- Visitor behaviour patterns became visible. Peak times, dead periods, how visitors actually flowed through the experience, where congestion or drop-off happened. That fed directly into layout changes, better visitor journey design, and a list of bottlenecks to design out next time.
- Zone-level performance became measurable. Which zones pulled traffic, which held attention, which were underperforming. Decisions about the next activation could lean on evidence instead of the loudest voice in the post-show debrief.
From Insight to Action
Armed with the data, Movico and their customer could identify the formats worth replicating and where to invest more, refine the zones that underperformed, improve layout and visitor flow at each stop, and line up zone placement more tightly with how audiences actually moved through the space.
The insights weren’t a one-off report. They created a repeatable framework for improving the next roadshow, and the one after that.
Strategic Impact
The biggest shift wasn’t better reporting. It was a new way of operating. Movico now has the foundation to benchmark performance across activations, compare locations and formats, and keep optimising experiential campaigns over time with evidence rather than guesswork. A strong step toward truly data-driven roadshow management.
Summary
By deploying Event Twin on their customer roadshow, Movico took a notoriously hard-to-measure marketing channel and turned it into a quantifiable, optimisable system: clear visibility into real visitor engagement, data-driven optimisation of experience design, sharper location and content strategy, and a scalable framework for every roadshow that follows.
“TwinLabs has changed how we think about roadshows — not just as events, but as environments we can measure, understand and improve.”
Stefan Aspers, CEO, Movico
Operational AI for physical spaces.
Read our latest news